


- Market Analysis
Checklist Available: What Is a Go-To-Market Strategy?
Use Cases by Objective
New Approach List

Group Strategy

Digital
Marketing

Client Information Registration

Data Cleansing
Corporate Attribute Analysis

SFA/MA Activation

Business Card Data Integration

Credit & Client Check

Use Cases by Department
Sales Department

Inside Sales
Department

Marketing &
Corporate Planning Department

Information Systems Department

Management Department

Use Cases by Tool
Meeting Sonar
Last Updated: June 30, 2025

Scientific Sales
Understand uSonar in 5 Minutes
When building sales strategies for products and services, sales and marketing teams must collaborate closely from various perspectives. Examples include creating target lists and planning promotional initiatives.
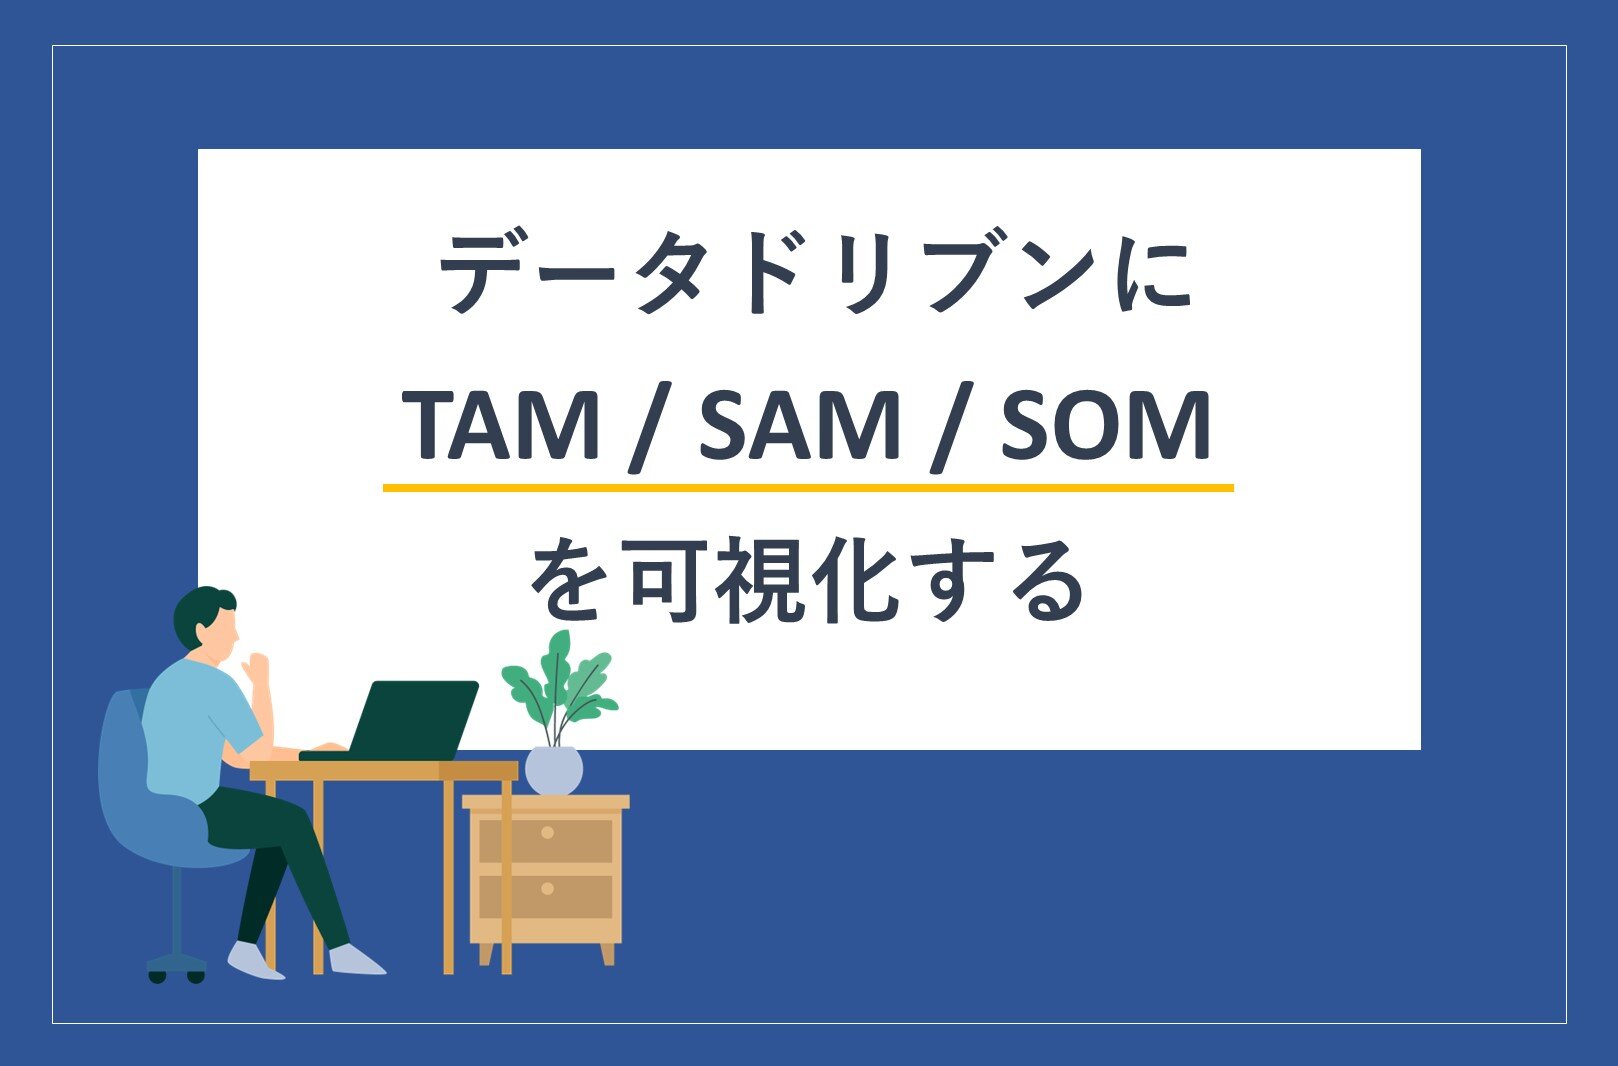
This article explains TAM as a method for identifying target markets and sharing their current status and future potential. Calculating the current market status and potential is essential for advancing a Go-To-Market strategy. Furthermore, high-quality industry and corporate data are required for these calculations.
Recommended Articles

The indicator representing the overall monetization opportunity for a product or service is referred to in English as the Total Addressable Market (TAM).
It is used to estimate and calculate specific market sizes, enabling the efficient creation of a list of potential customers.
By identifying the TAM, sales and marketing teams can develop individual approach strategies and plans based on the same list.
Corporate lists formed through data-driven methods allow companies to maximize their limited internal resources and focus on the most profitable opportunities.
This not only improves the efficiency of daily business activities but also serves as effective material for presenting corporate strategies to investors.
Furthermore, it is considered an important method for preventing wasted costs associated with indiscriminate outreach to every industry that might present an opportunity.
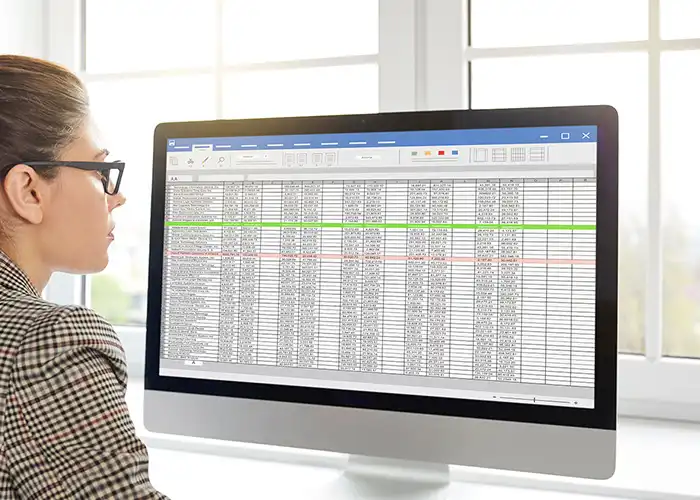
Using a corporate database is considered the most efficient way to identify companies included in the TAM.
Specifically, corporate characteristics and the actual number of companies are visualized using industry, annual revenue, number of employees, and location.
Regarding which segment of the visualized companies to target first, the process is divided into two methods: grouping companies and assigning priority scores.
This is a method of creating groups based on industry and number of employees.
It allows for the identification of companies with high unit prices and high acquisition potential, while excluding industries that contain many companies with small deal sizes and high risks of losing the deal.
This is a method of scoring companies that have high similarity to existing customers.
Items used to measure similarity include the following:
After understanding customer characteristics, you can proceed to calculate the market size.
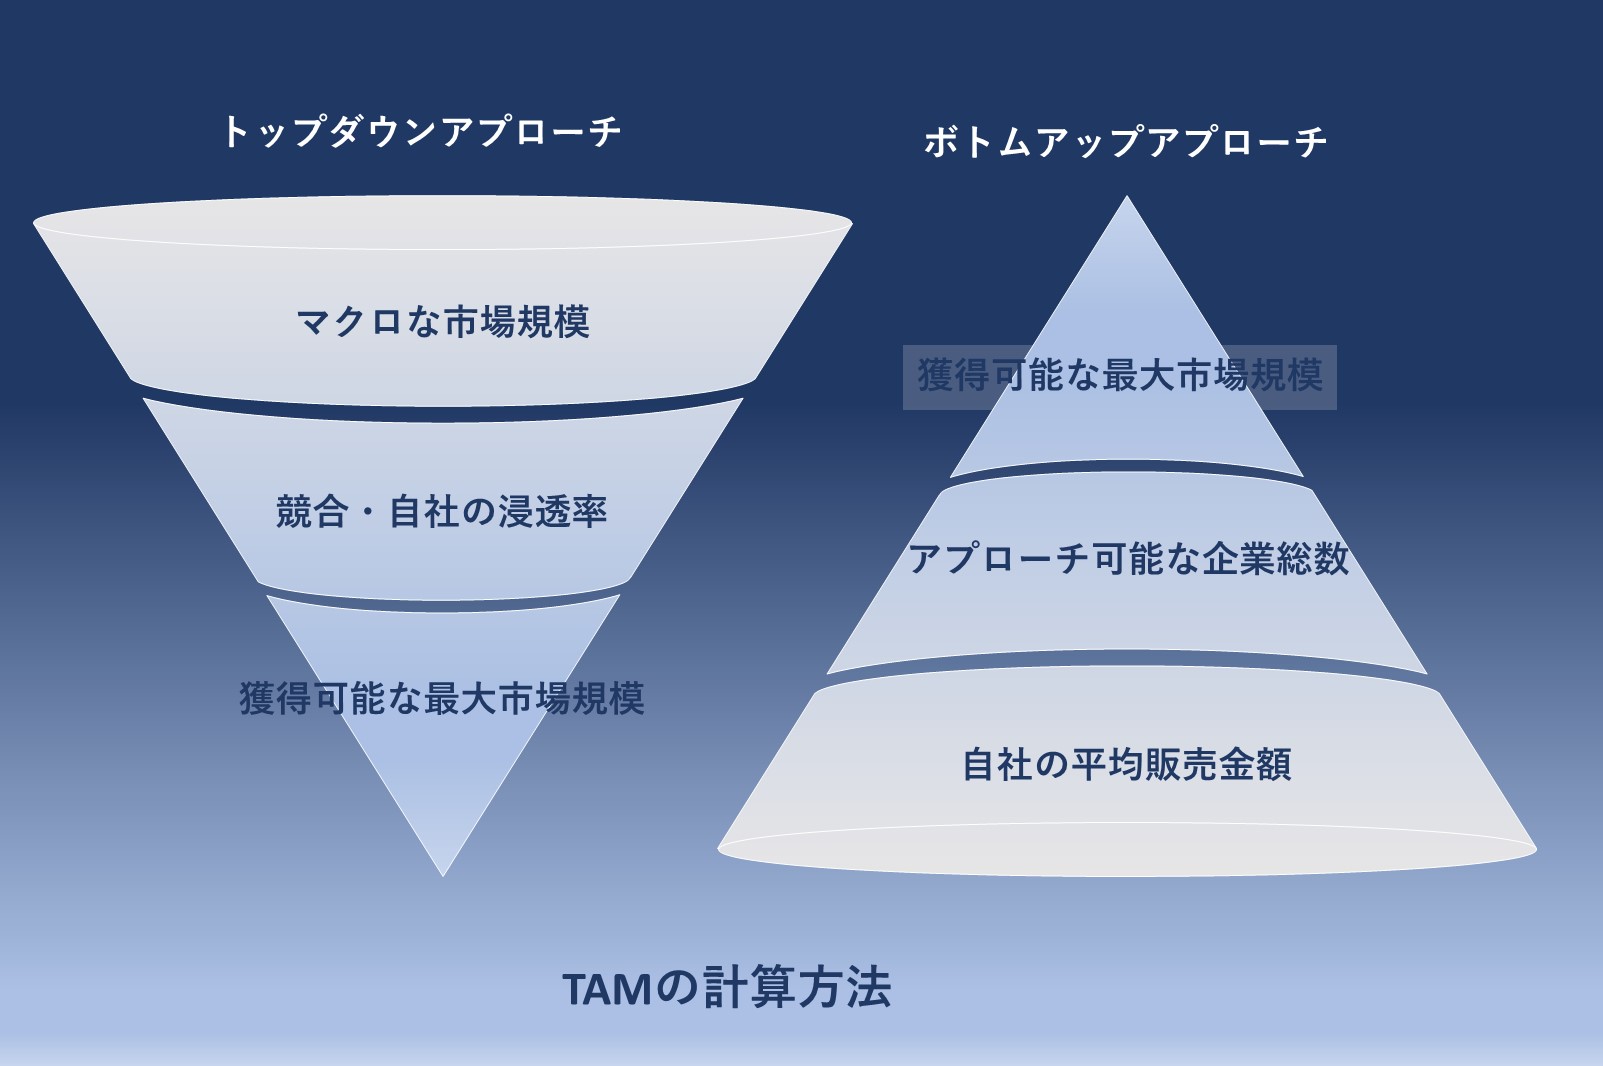
There are two commonly cited approaches for this calculation: Top-Down and Bottom-Up.
TAM calculated using the Bottom-Up approach is sometimes referred to as SAM (Serviceable Available Market) or SOM (Serviceable Obtainable Market).
This method involves visualizing the entire target market, breaking it down by industry, and multiplying these segments by data provided by specialized institutions.
The calculation process follows this logic: "The market size for this industry is X yen, and we define our TAM as Y% of that market, which meets specific criteria such as A and B."
In this process, companies that meet the usage criteria for your products or services are identified from a macro perspective, which is typically represented as an inverted pyramid.
As one method for Top-Down TAM calculation, uSonar offers a "TAM Calculation Simulator" that leverages "LBC," our proprietary corporate database covering 12.5 million locations nationwide.
Calculate Your Company's TAM Here:
This method involves multiplying the total number of target prospects by your company's average sales value to estimate the scale of market demand.
Another approach involves conducting surveys among potential customers to gather more accurate conversion probability data for the calculation.
More precise estimates can be achieved by distinguishing between small-to-medium enterprises and large corporations, and calculating the sum of the average sales values for each group.
In this process, companies that meet the usage criteria for your products or services are identified from a micro perspective, which is typically represented as a pyramid.
The following axes are considered important when selecting companies to include in your TAM:
By using the selection criteria above, you can appropriately forecast market and corporate growth.
By calculating TAM, companies can communicate their activity goals both internally and externally, accurately grasp their current position, and explain the steps they will take to advance.
Whether planning medium-to-long-term strategies or making quarterly investment decisions, having a calculated TAM allows for data-driven judgments on which areas to allocate resources to and in what amounts.
Our service, PLANSonar, introduced in this article, provides the latest corporate data necessary for calculating TAM and SAM, enabling the visualization of your target market. Furthermore, it enables the calculation of SOM by integrating with SFA and CRM systems.
About the Author
uSonar Editorial Department
MX Group Editor-in-Chief
This is the uSonar Editorial Department.
We provide information on data utilization and digital technologies useful for considering future business operations, primarily for companies engaged in B2B business.
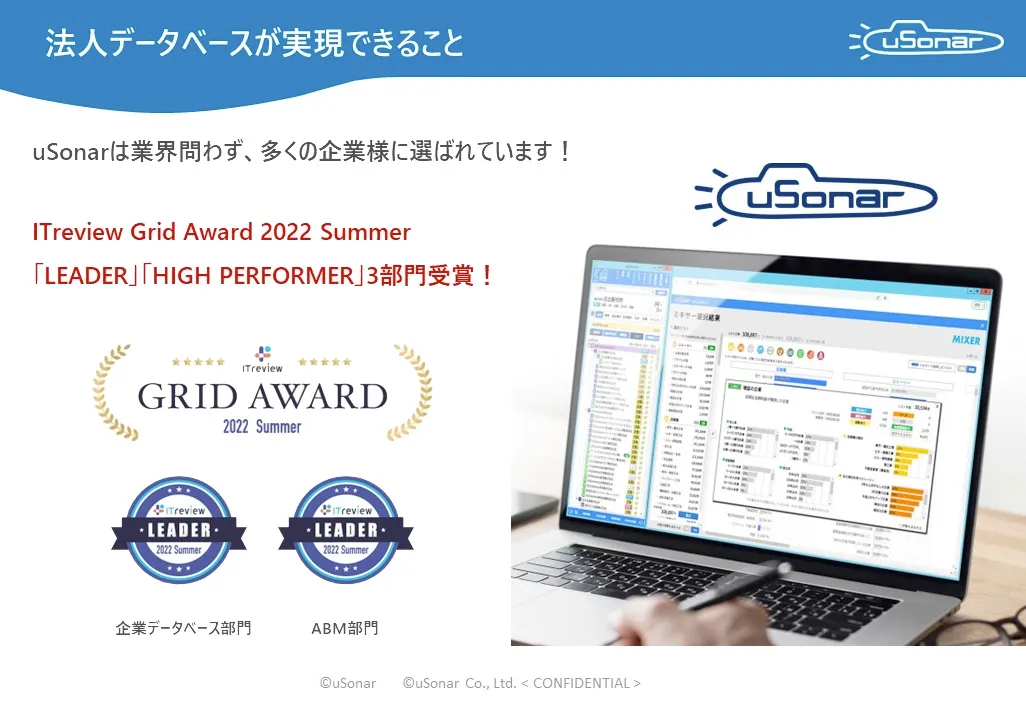
uSonar is utilized by various companies
across all industries and sectors.
ITreview Grid Award 2026 Summer
Leader in 6 Categories

With uSonar,
we can guide your company toward solving its challenges!
Case Studies and Sample Reports
Download