


- Market Analysis
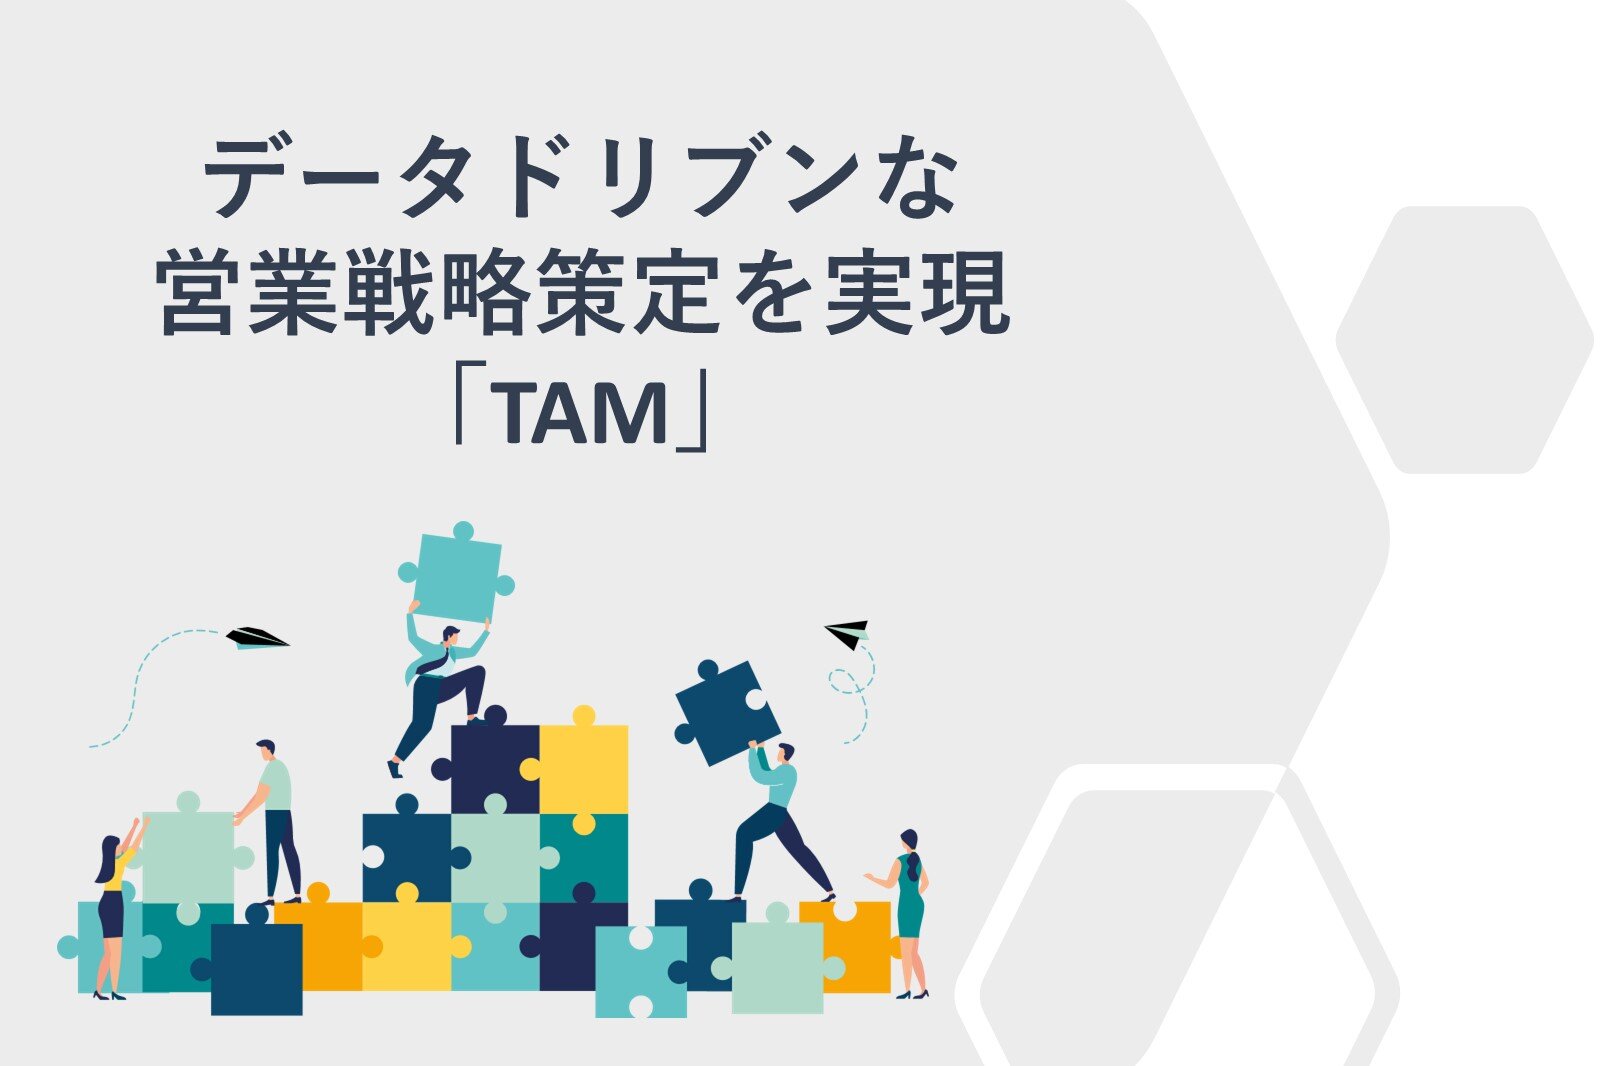
What is TAM, Essential for Data-Driven Sales Strategy?
Use Cases by Objective
New Approach List

Group Strategy

Digital
Marketing

Client Information Registration

Data Cleansing
Corporate Attribute Analysis

SFA/MA Activation

Business Card Data Integration

Credit & Client Check

Use Cases by Department
Sales Department

Inside Sales
Department

Marketing &
Corporate Planning Department

Information Systems Department

Management Department

Use Cases by Tool
Meeting Sonar
Last Updated: June 30, 2025
Click Here to Learn About Market Analysis in One Place ▶
What Is the Reality of Data Utilization
in Market Development?
When developing markets for your products or services, it is essential to grasp the total market size and set strategic goals. TAM, SAM, and SOM are cited as effective indicators for market analysis.
On the other hand, while many understand the importance of visualizing TAM, SAM, and SOM, there are likely many who are unsure of how to proceed specifically.
In this article, we introduce methods for market analysis using TAM, SAM, and SOM, as well as how to actually calculate your company's TAM.
Recommended Articles

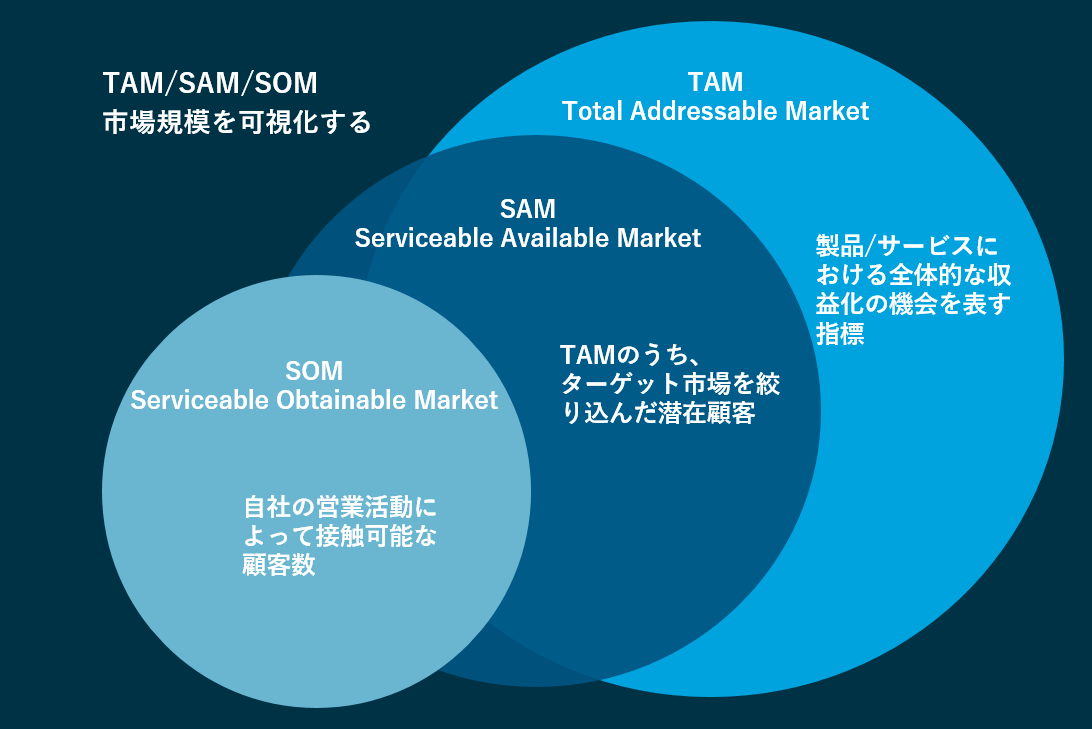
The indicator representing the total revenue opportunity for a product or service is called the Total Addressable Market (TAM).
It is defined as the maximum potential market size and is considered a valuable tool for efficiently identifying potential customers.
The portion of the TAM that represents your specific target market is called the Serviceable Available Market (SAM).
The portion of the SAM that your company can realistically reach through its sales activities is called the Serviceable Obtainable Market (SOM).
Since the SOM can be viewed as the target market share for your product or service, it is frequently used to calculate corporate sales targets.
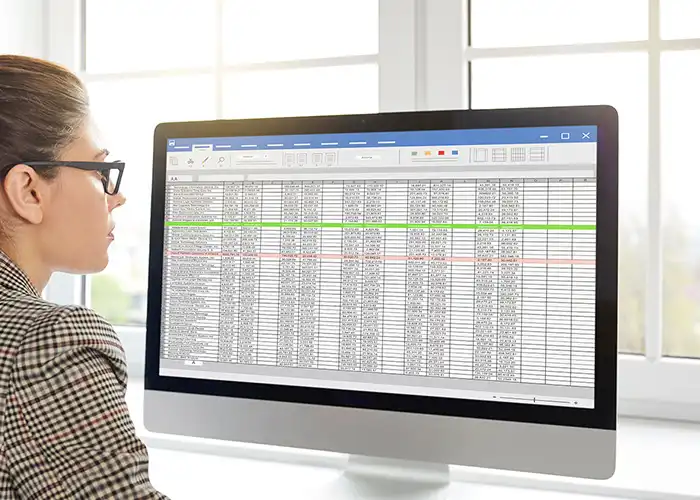
Accurate corporate data is essential for understanding TAM, SAM, and SOM.
While calculating TAM efficiently is important, it requires having a reliable foundation of corporate data.
Here, you can calculate your company's TAM by utilizing LBC, a proprietary corporate database covering 12.5 million locations across Japan, built by uSonar.
Start by calculating the TAM for your company or business.
Calculate Your TAM Here:
Furthermore, to perform the necessary filtering to create SAM and SOM, it is crucial to understand the corporate characteristics of both your current and potential customers.
The ability to filter by criteria such as industry and number of employees, as well as by "challenges" and "interests," significantly improves the precision of your targeting.
Additionally, the freshness of the information used for filtering is also critical.
PLANSonar, developed by our company, allows you to create filtered corporate lists using the latest corporate data.
This enables you not only to define the market your company can approach but also to extract specific company lists.
Furthermore, you can integrate detailed information about the filtered companies into your SFA or CRM. This allows you to formulate sales strategies focused on the customers your company can effectively reach.
For more information on features, please check the details of PLANSonar on this page, or feel free to contact us via the form at the bottom of this page.
PLANSonar, which is powered by our proprietary corporate database, allows you to easily create filtered corporate lists.
If you are interested in visualizing TAM, SAM, and SOM after reading this article, please feel free to contact us.
About the Author
uSonar Editorial Department
MX Group, Editor-in-Chief
This is the uSonar Editorial Department.
We provide information on data utilization and digital technologies useful for B2B companies to rethink their future business operations.
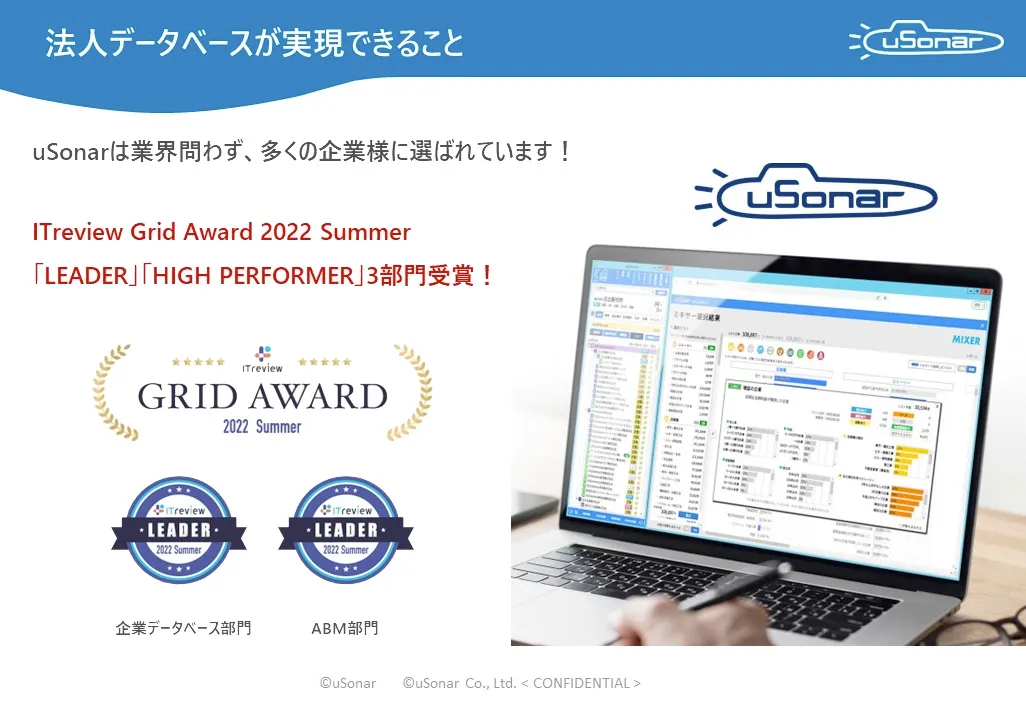
uSonar is utilized by various companies
across all industries and sectors.
ITreview Grid Award 2026 Summer
Leader in 6 Categories

With uSonar,
we can help solve your company's challenges!
Case Studies and Sample Reports
Download