


Corporate News
uSonar Co., Ltd. (Shinjuku-ku, Tokyo; Nami Fukutomi, Chairman; Katsuhito Nagatake, President; hereinafter "uSonar"), which maintains LBC, Japan's largest* corporate database, has launched the "Microcosm of Japanese Companies (≒ Japanese Economy) Report," a statistical analysis information service utilizing LBC. We are announcing six report examples.
*Largest in Japan for data on the number of headquarters and business locations of Japanese companies (based on our own research as of July 16, 2024)
Background of the "Microcosm of Japanese Companies (≒ Japanese Economy) Report"
uSonar maintains LBC, one of Japan's largest corporate databases, covering 8.2 million business locations. LBC structures data for nearly every business entity, from large enterprises to small and medium-sized businesses and sole proprietorships.
Furthermore, it links a wide variety of attribute information, including basic details such as addresses, phone numbers, executives, industry types, employee counts, and capital.
The data is primarily sourced from publicly available information, including securities reports, official gazettes, corporate registries, and government announcements. LBC is commonly utilized by sales, marketing, and market analysis departments in companies advancing "Data-Driven Management" and "Data Utilization."
The "Microcosm of Japanese Companies (≒ Japanese Economy) Report" leverages this corporate data as a source for statistical analysis services.
Specific Analysis Reports
Below, we introduce the reports (summary versions) created as the first installment in this series.
1: Ranking of Prefectures with the Most Certified Companies for the 2024 Health & Productivity Management Outstanding Organizations Recognition Program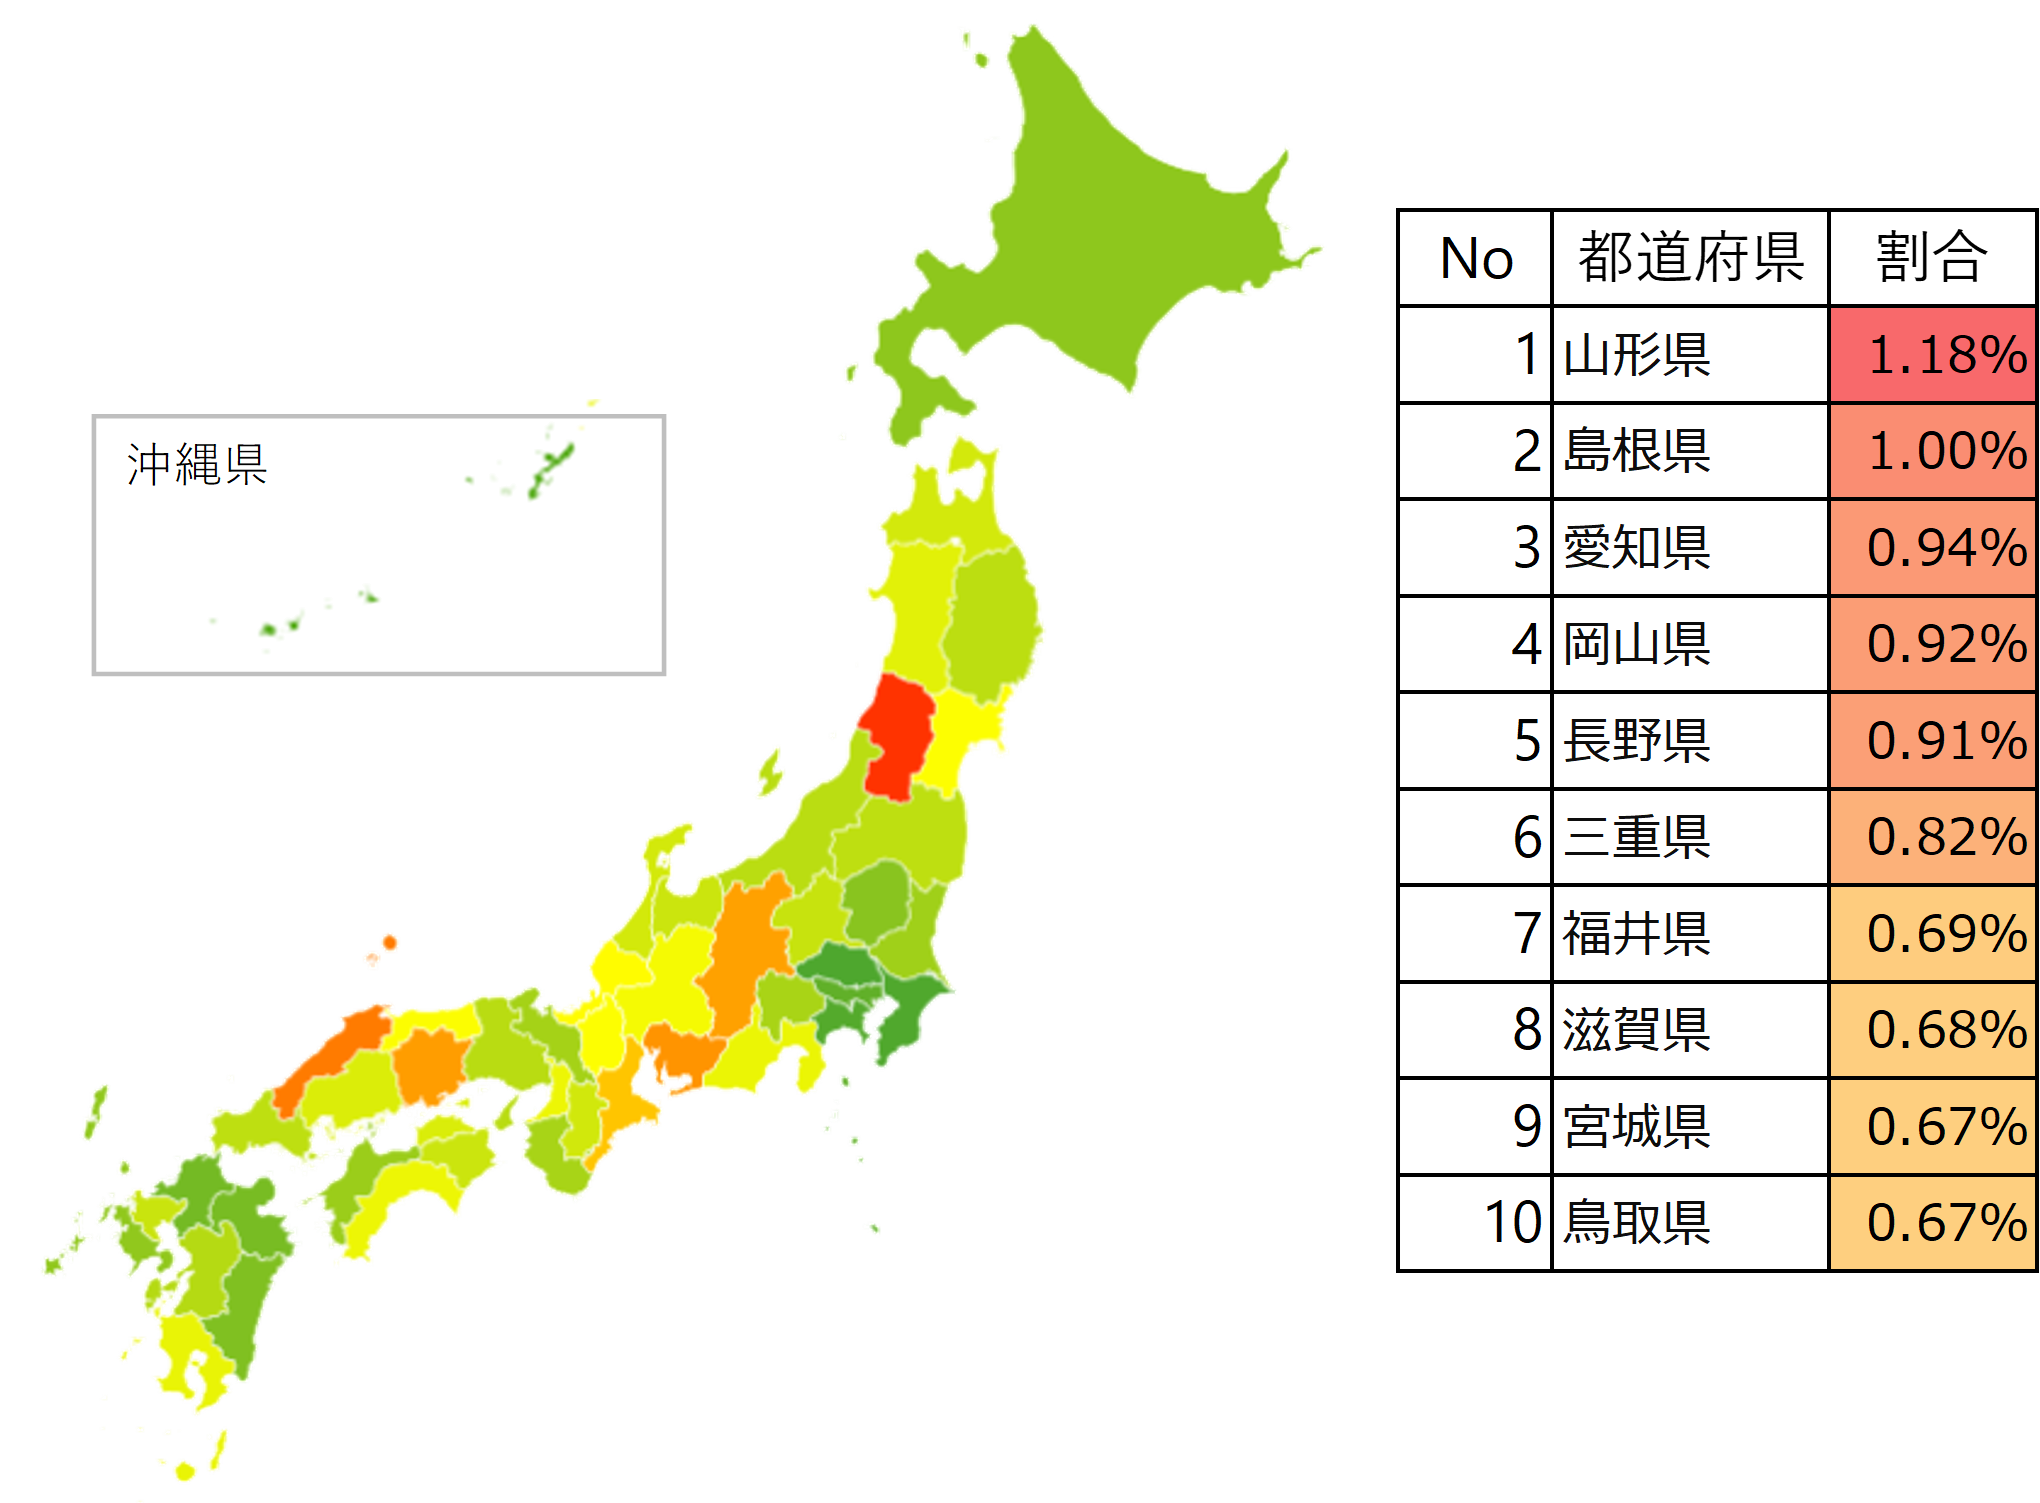
|
Population Data |
LBC head office data for active, non-bankrupt corporations with a Corporate Number as of May 2024 Approximately 4.52 million companies (applies to the following reports as well) |
|
Characteristics of Population Data |
LBC covers information on nearly all companies and corporations across Japan, which is utilized as the population data. For this report, we have limited the scope to active, non-bankrupt corporations that possess a Corporate Number and have a registered incorporation (applies to the following reports as well). |
|
Analysis Target Data |
Certified Health & Productivity Management Outstanding Organizations 2024 List (Approx. 20,000 Companies) |
|
Data Sources for Analysis |
Data published on the Ministry of Economy, Trade and Industry (METI) website |
|
Analysis and Aggregation Methodology |
LBC headquarters data was categorized by prefecture to establish the population for each region. Data on Certified Health & Productivity Management Outstanding Organizations was also categorized by prefecture. The ratio for each prefecture was calculated, and a ranking was created and mapped based on the highest percentages. |
|
Insights and Evaluations Obtained |
The purpose of this corporate certification system by the Ministry of Economy, Trade and Industry is to visualize large enterprises and SMEs that practice excellent health and productivity management, enabling them to be recognized by employees, job seekers, affiliated companies, and financial institutions. Established in fiscal year 2016. As interest grows among companies, we created a prefecture map to identify which regions are most proactive in obtaining certification. Yamagata, Shimane, Aichi, Okayama, and Nagano ranked at the top. This trend was also confirmed in the materials provided on the Ministry of Economy, Trade and Industry website. |
2: Ranking of Prefectures with the Highest Number of Companies with December Fiscal Year-Ends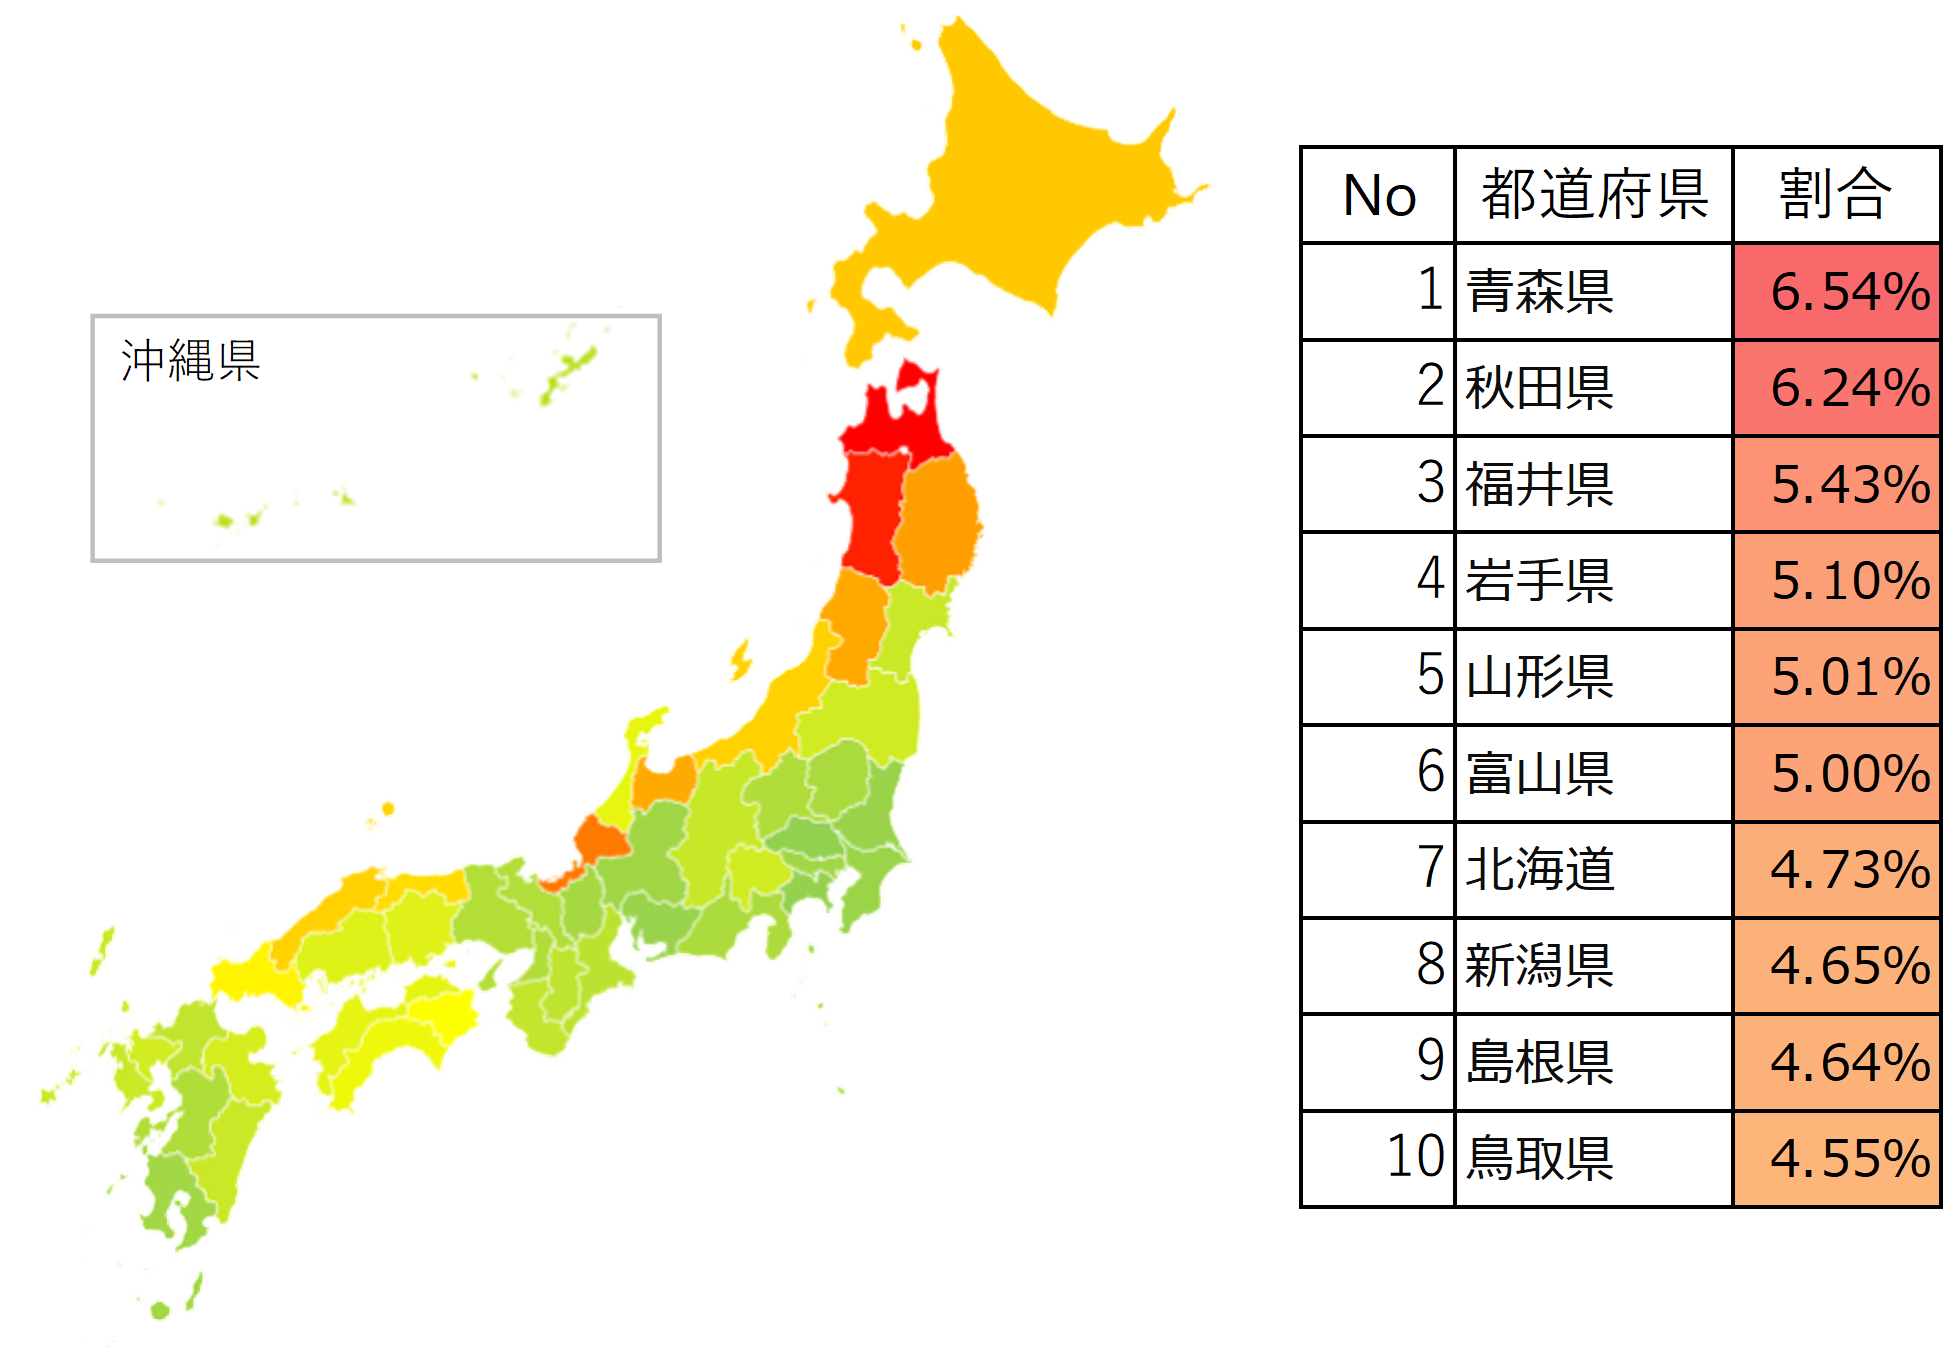
|
Data Analyzed |
Stories of Companies with December Fiscal Year-Ends (Approx. 125,000 Companies) |
|
Data Sources |
Securities Reports and Other Sources |
|
Analysis Methodology |
LBC headquarters data was categorized by prefecture to establish the population for each region. Companies with December fiscal year-ends were categorized by prefecture. The ratio for each prefecture was calculated, and a ranking was created and mapped based on the highest percentages. |
|
Insights and Evaluations |
The results indicate a high concentration of these companies, particularly in the Tohoku and Sea of Japan coastal regions. |
3: Ranking of Prefectures with the Highest Number of Companies Holding 1 to 5 Patents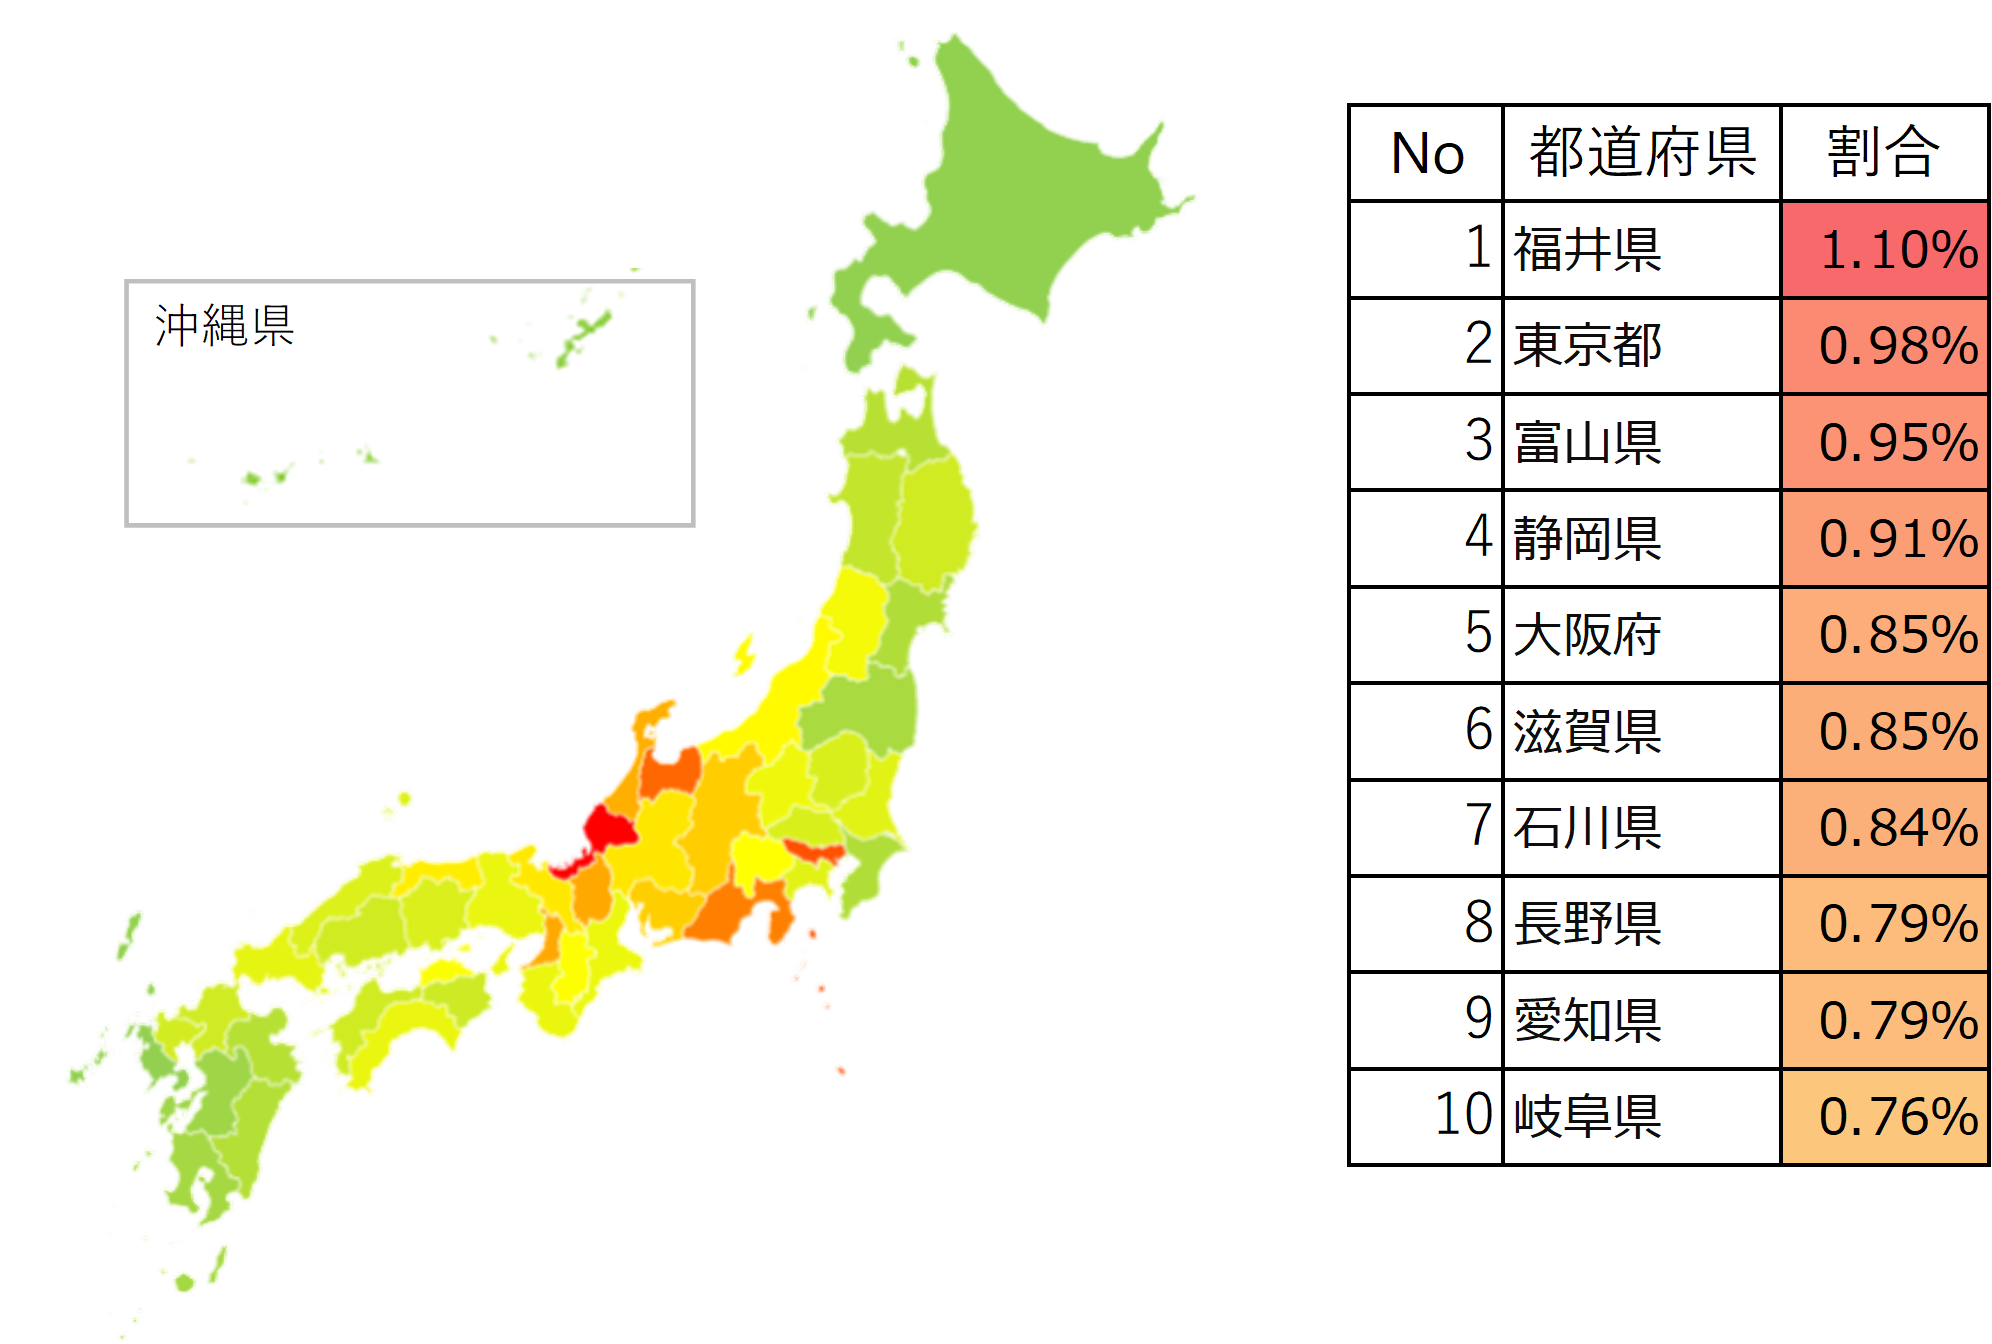
|
Analysis Target Data |
Story of "Companies Holding 1 to 5 Patents" (Approximately 32,000 Companies) |
|
Analysis Data Source |
Data from the Japan Patent Office website |
|
Analysis and Aggregation Methodology |
LBC headquarters data was categorized by prefecture to establish a population count for each. Companies holding 1 to 5 patents were categorized by prefecture. The ratio for each prefecture was calculated, and a ranking was created and mapped in descending order of these ratios. |
|
Insights and Evaluations Obtained |
It can be observed that the proportion is higher in companies located in the Chubu and Hokuriku regions, as well as in Tokyo.
|
4: Ranking of Prefectures with a High Number of Companies Led by Female Presidents 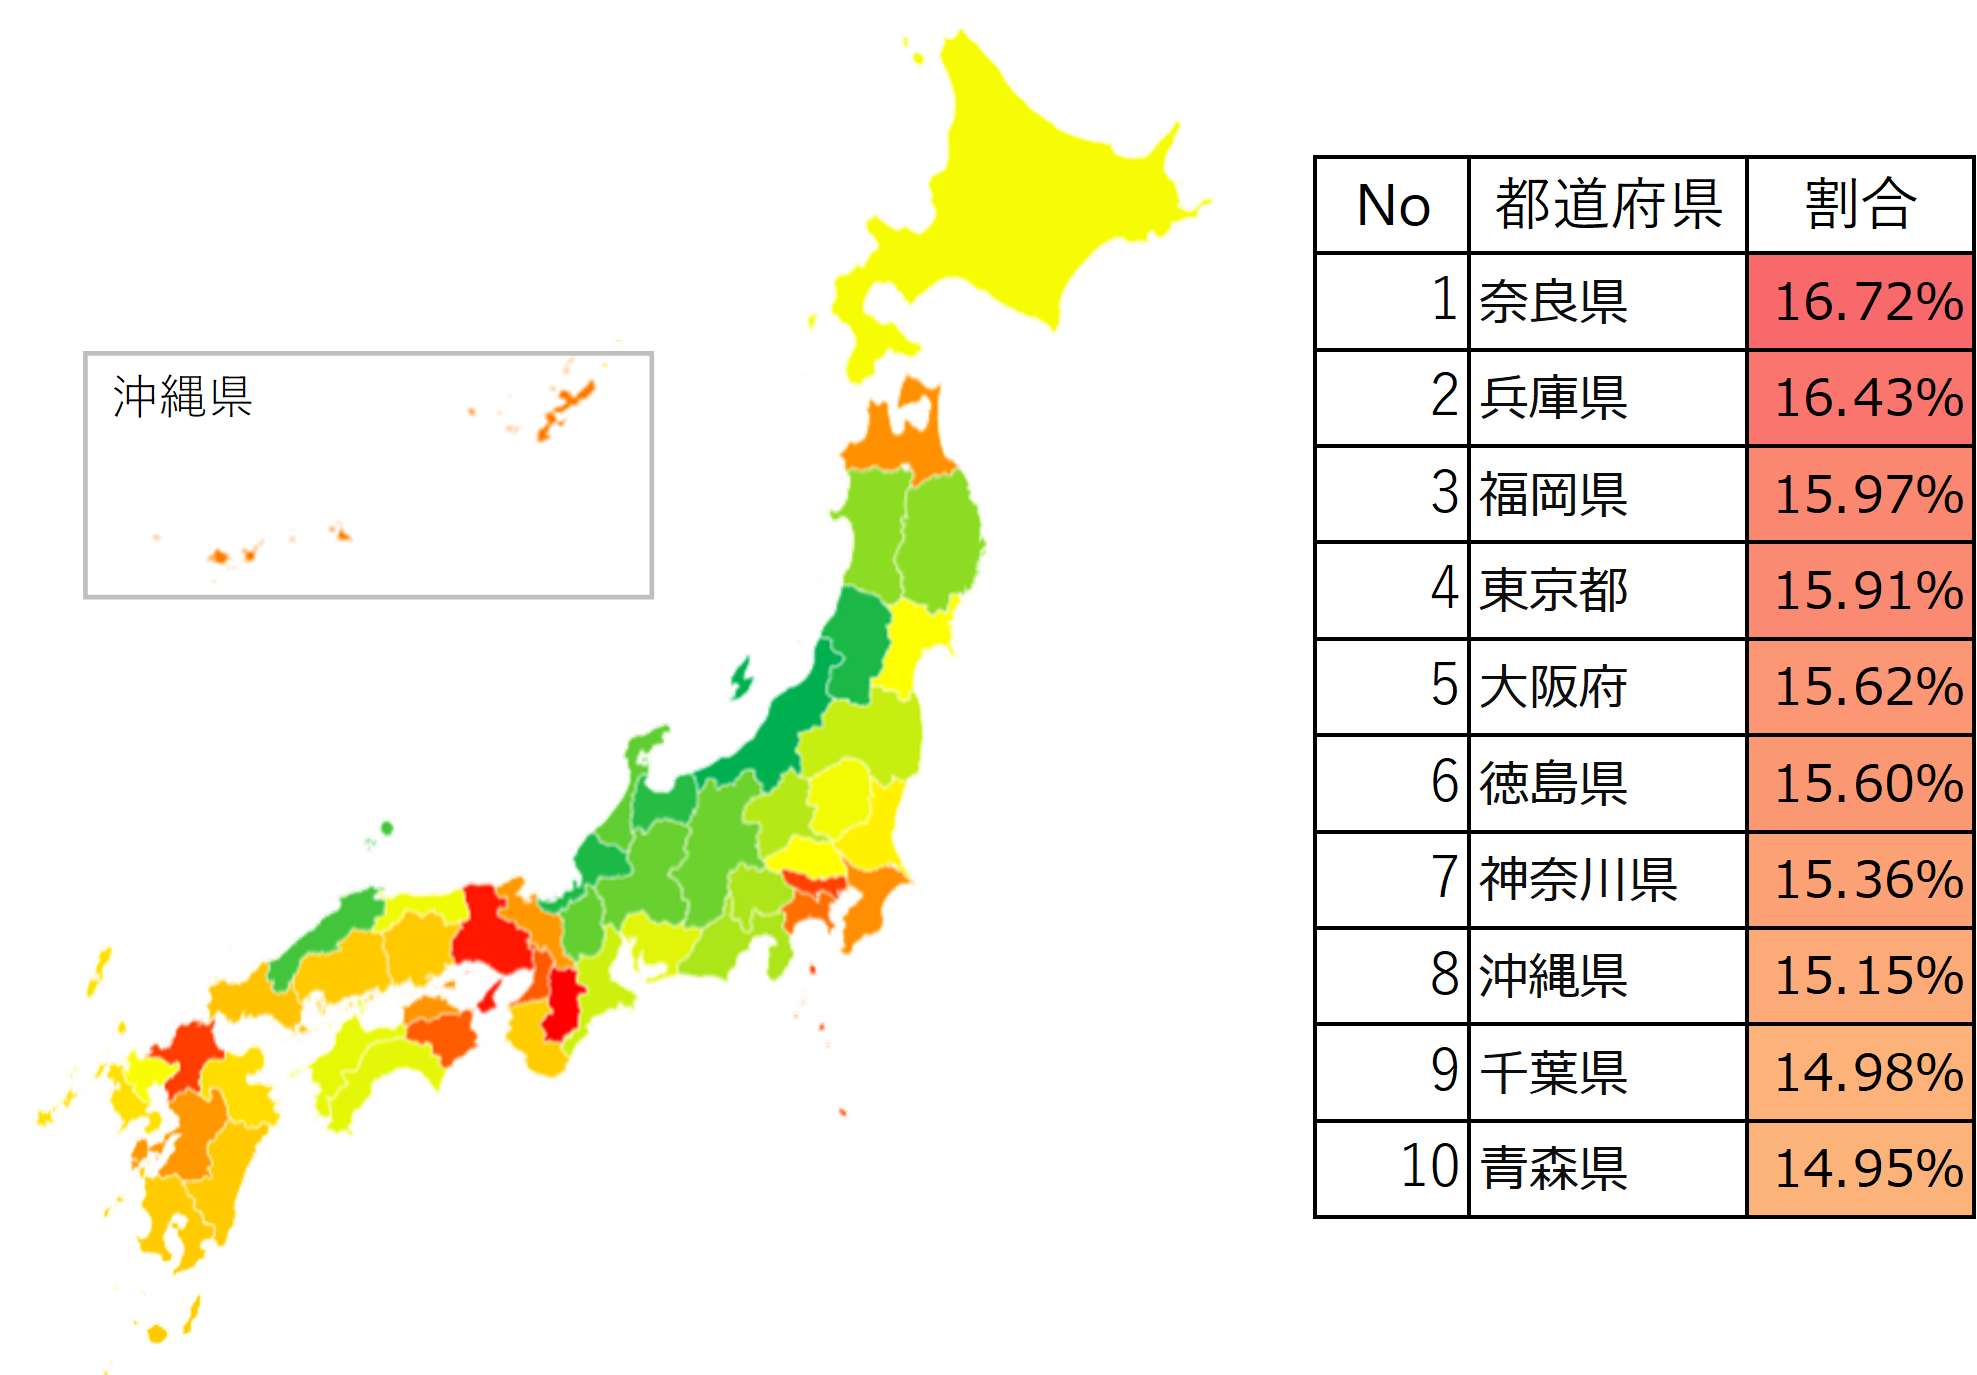
|
Data Analyzed |
Story of "Companies Led by Female Presidents" (Approximately 657,000 companies) |
|
Data Sources Analyzed |
Extracted using proprietary logic |
|
Analysis and Aggregation Methodology |
LBC headquarters data was categorized by prefecture to establish the population for each prefecture. Companies identified as being led by female presidents were also categorized by prefecture. Calculate the ratio for each prefecture, rank them in descending order, and visualize the data on a map. |
|
Insights and Evaluations Obtained |
A high trend is observed in areas with major metropolitan centers, such as the Tokyo Metropolitan Area, Kansai, and Northern Kyushu. However, the extraction logic is based on our company's definition, and further examination will be conducted. |
5: Ranking of Prefectures with a High Number of Likely Family-Owned Businesses 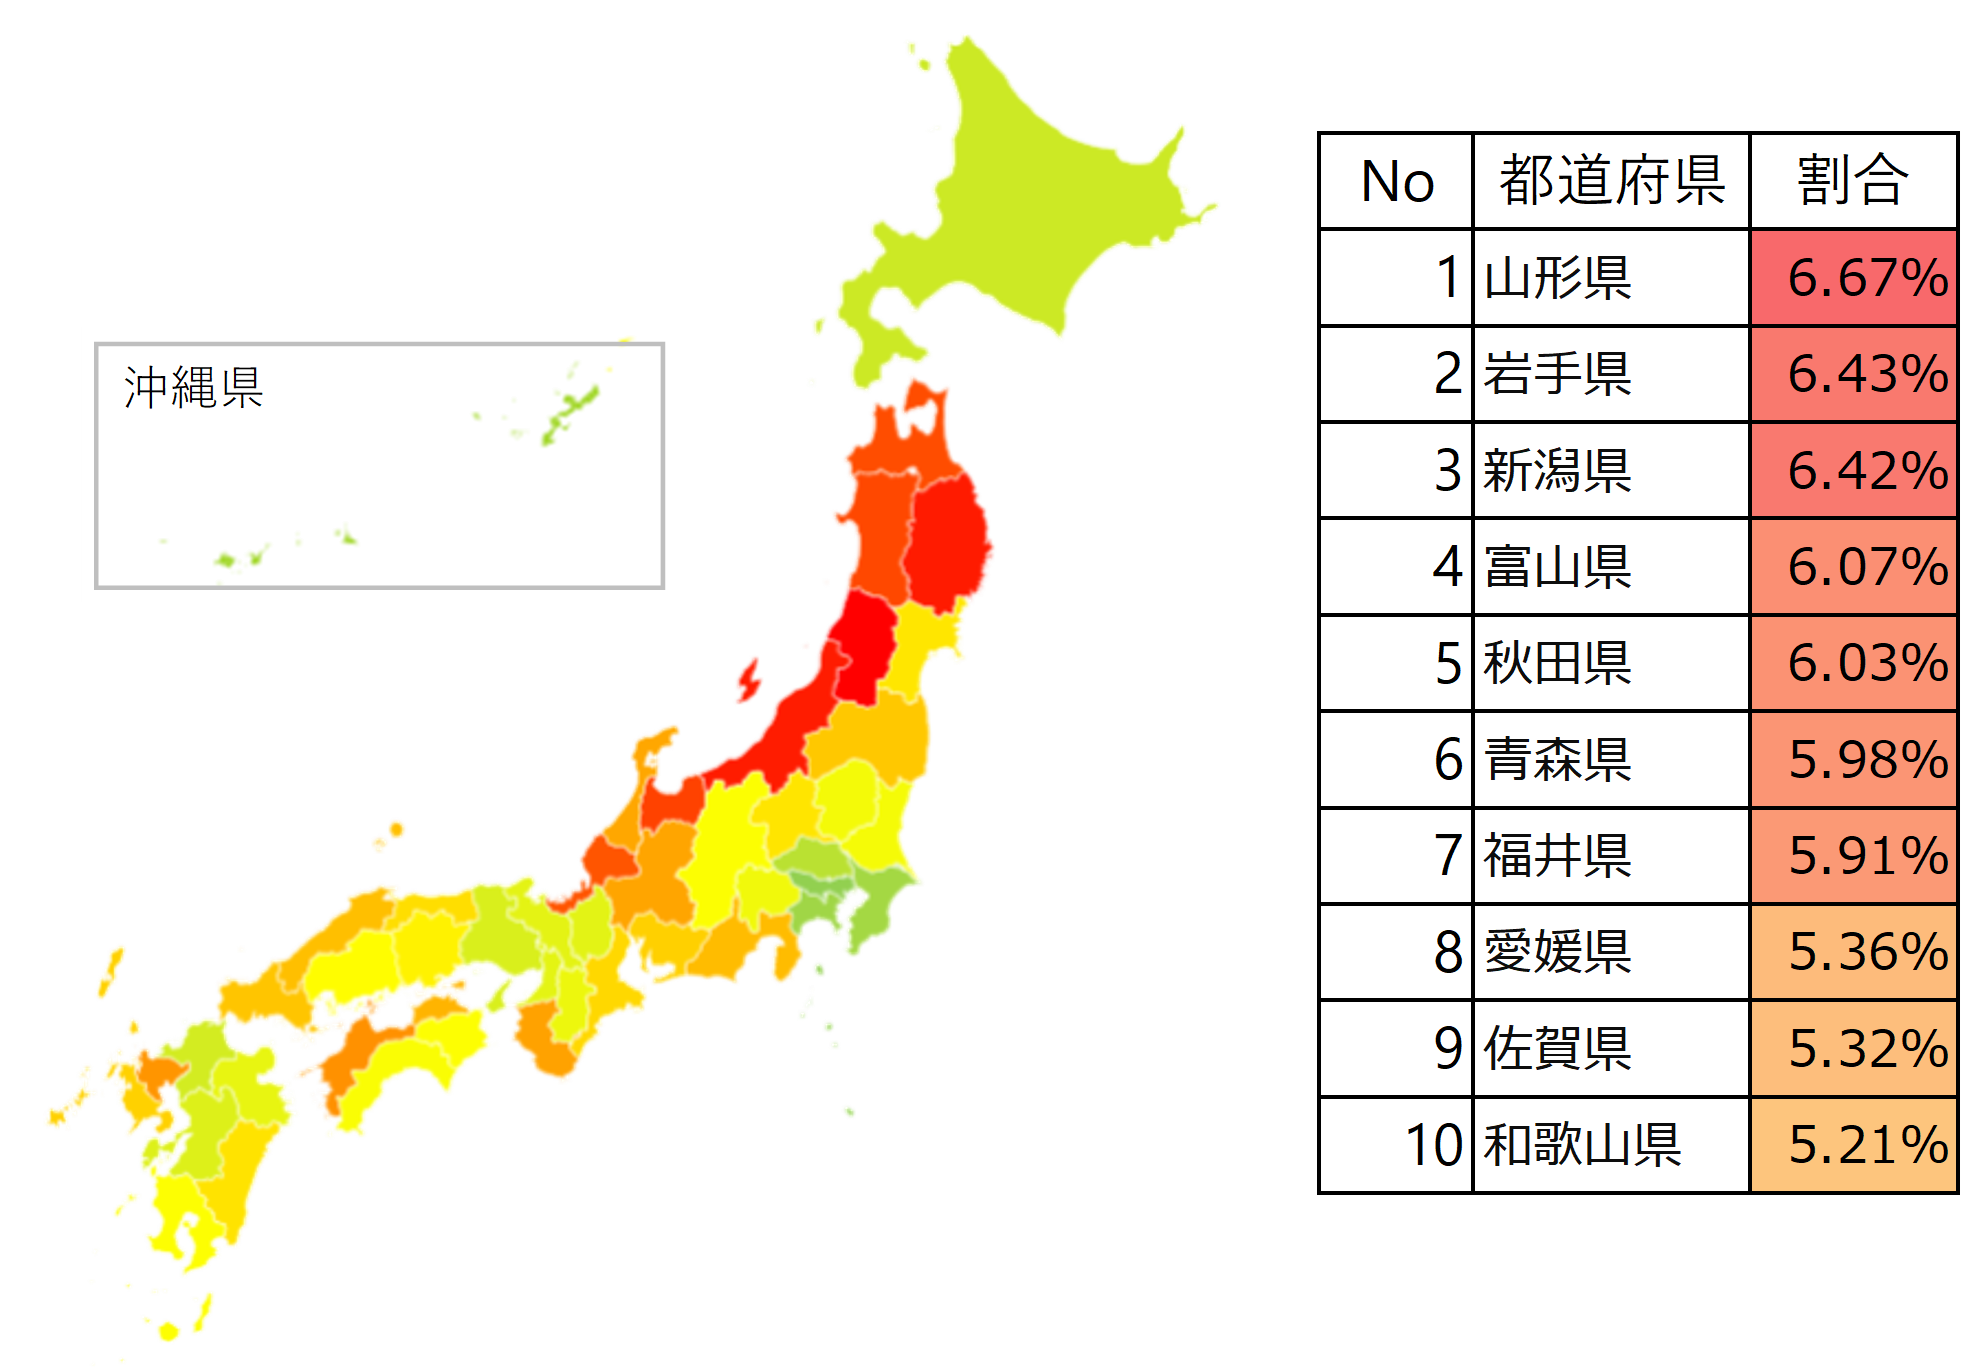
|
Analysis Target Data |
Likely Family-Owned Business Story (Approximately 160,000 companies) |
|
Analysis Data Source |
Extraction via proprietary logic |
|
Analysis and Aggregation Methodology |
Classify LBC headquarters data by prefecture to establish the population size for each prefecture. Classify "Family-Owned Businesses" by prefecture. Calculate the percentage for each prefecture, rank them in descending order, and visualize the data on a map. |
|
Insights and Evaluations Obtained |
A trend of higher percentages was observed in the Tohoku and Sea of Japan regions.
|
6: Research Report on the Newly Developed "Corporate Dissolution Score"
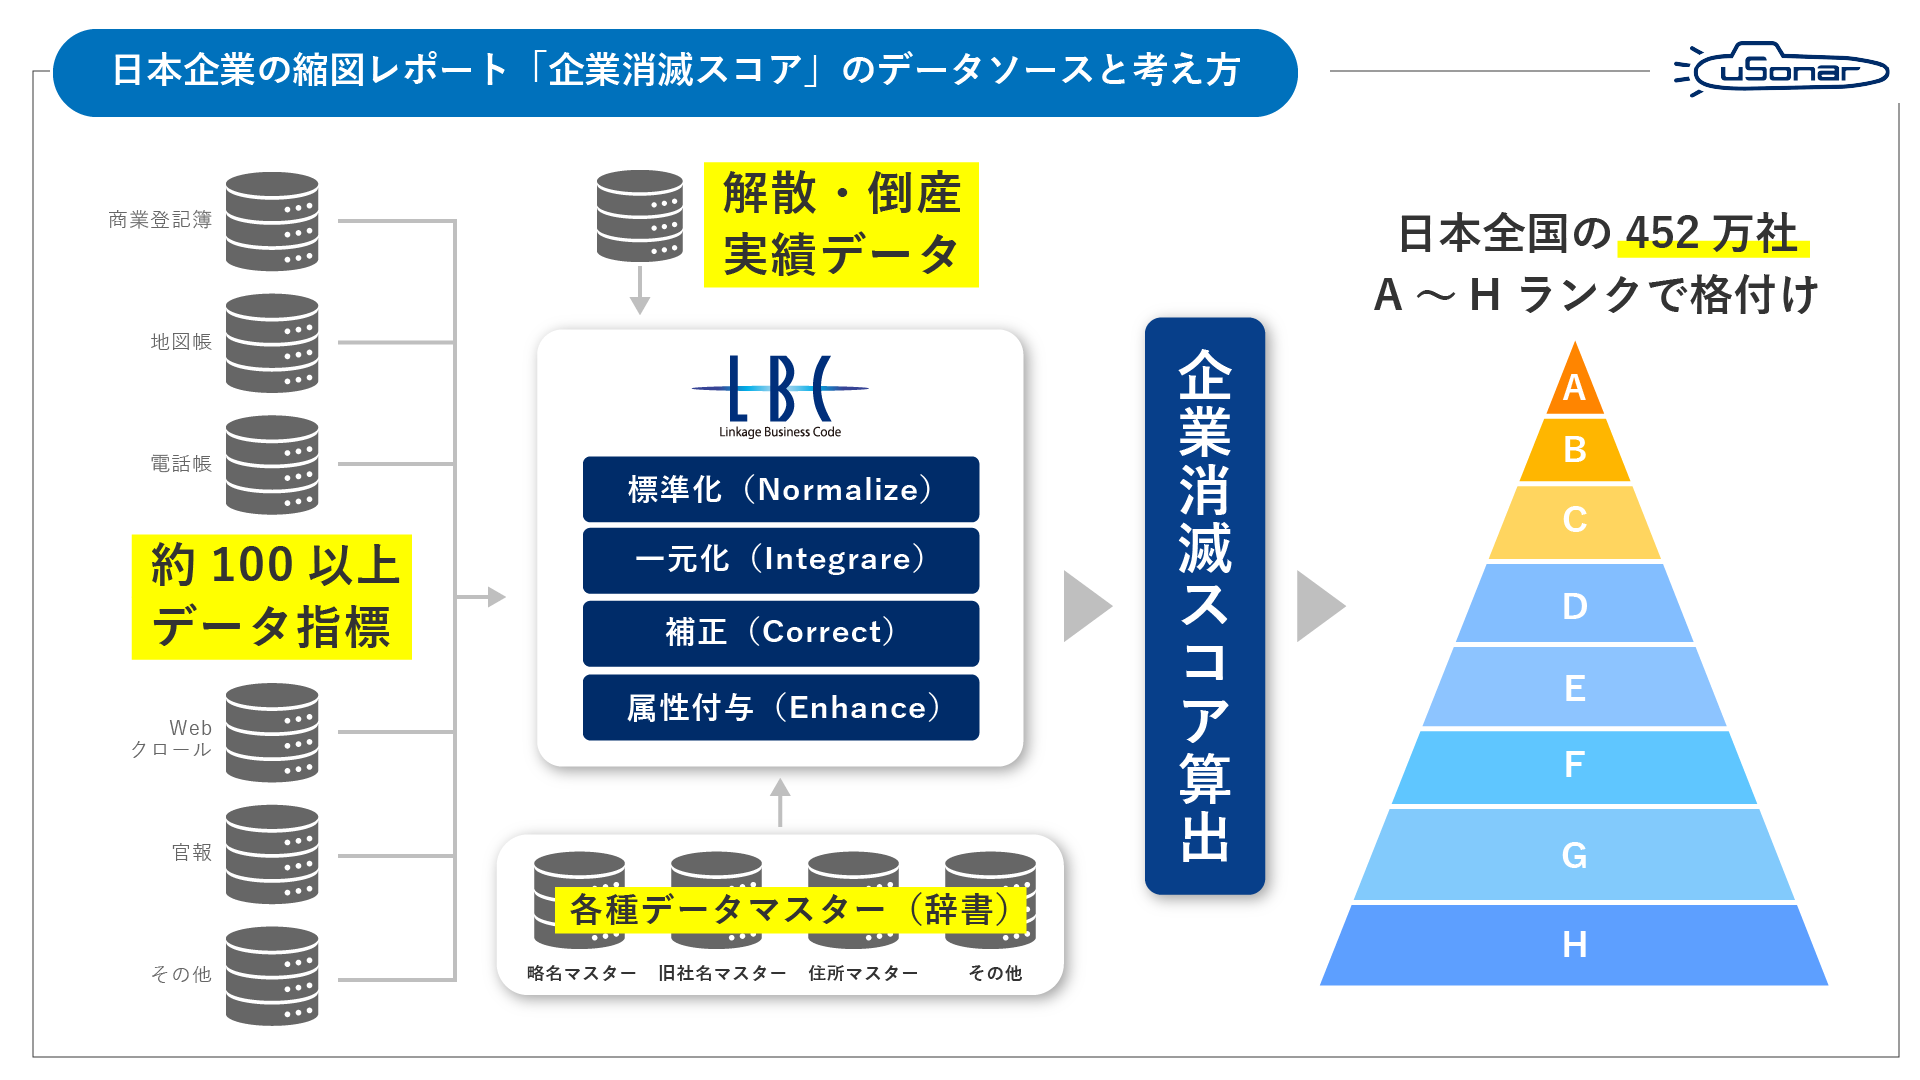 We have calculated our proprietary "Corporate Dissolution Score" by analyzing the characteristics and trends of 4.52 million corporate records in our database, incorporating over 100 diverse data indicators, including data on dissolved and bankrupt entities. Based on the score, we have assigned ratings across eight levels from A to H (details of the calculation logic remain undisclosed as this is currently under development and pilot testing).
Furthermore, we analyzed the relationship between various corporate attributes and the Corporate Dissolution Score.
As a result, we identified corporate attributes that frequently appear in the top-tier ranks (A–B) and those that frequently appear in the bottom-tier ranks (G–H).
For example, we found that 97% of companies with the "Certified Health & Productivity Management Outstanding Organization" attribute fall into the A–B category of the Corporate Dissolution Score.
Additionally, we found that 13% of companies with the attribute of "having a stylish cafe in the same building" fall into the G–H category of the Corporate Dissolution Score.
Please note that no single corporate attribute acts as a dominant factor within the Corporate Dissolution Score; rather, the score itself is a comprehensive metric derived from various data points. The Corporate Dissolution Score is currently in the pilot testing phase, and we will continue to refine its accuracy.
Notes on Citing This Report
• Please include the following credit when citing this report:
Source: "Microcosm of Japanese Companies Report" provided by uSonar Co., Ltd.
• Please include a link to the specific report cited below the source credit.
• If you notify us of your publication, we may feature it on our website or official social media channels.
Overview of the "Microcosm of Japanese Companies (≒ Japanese Economy) Report"
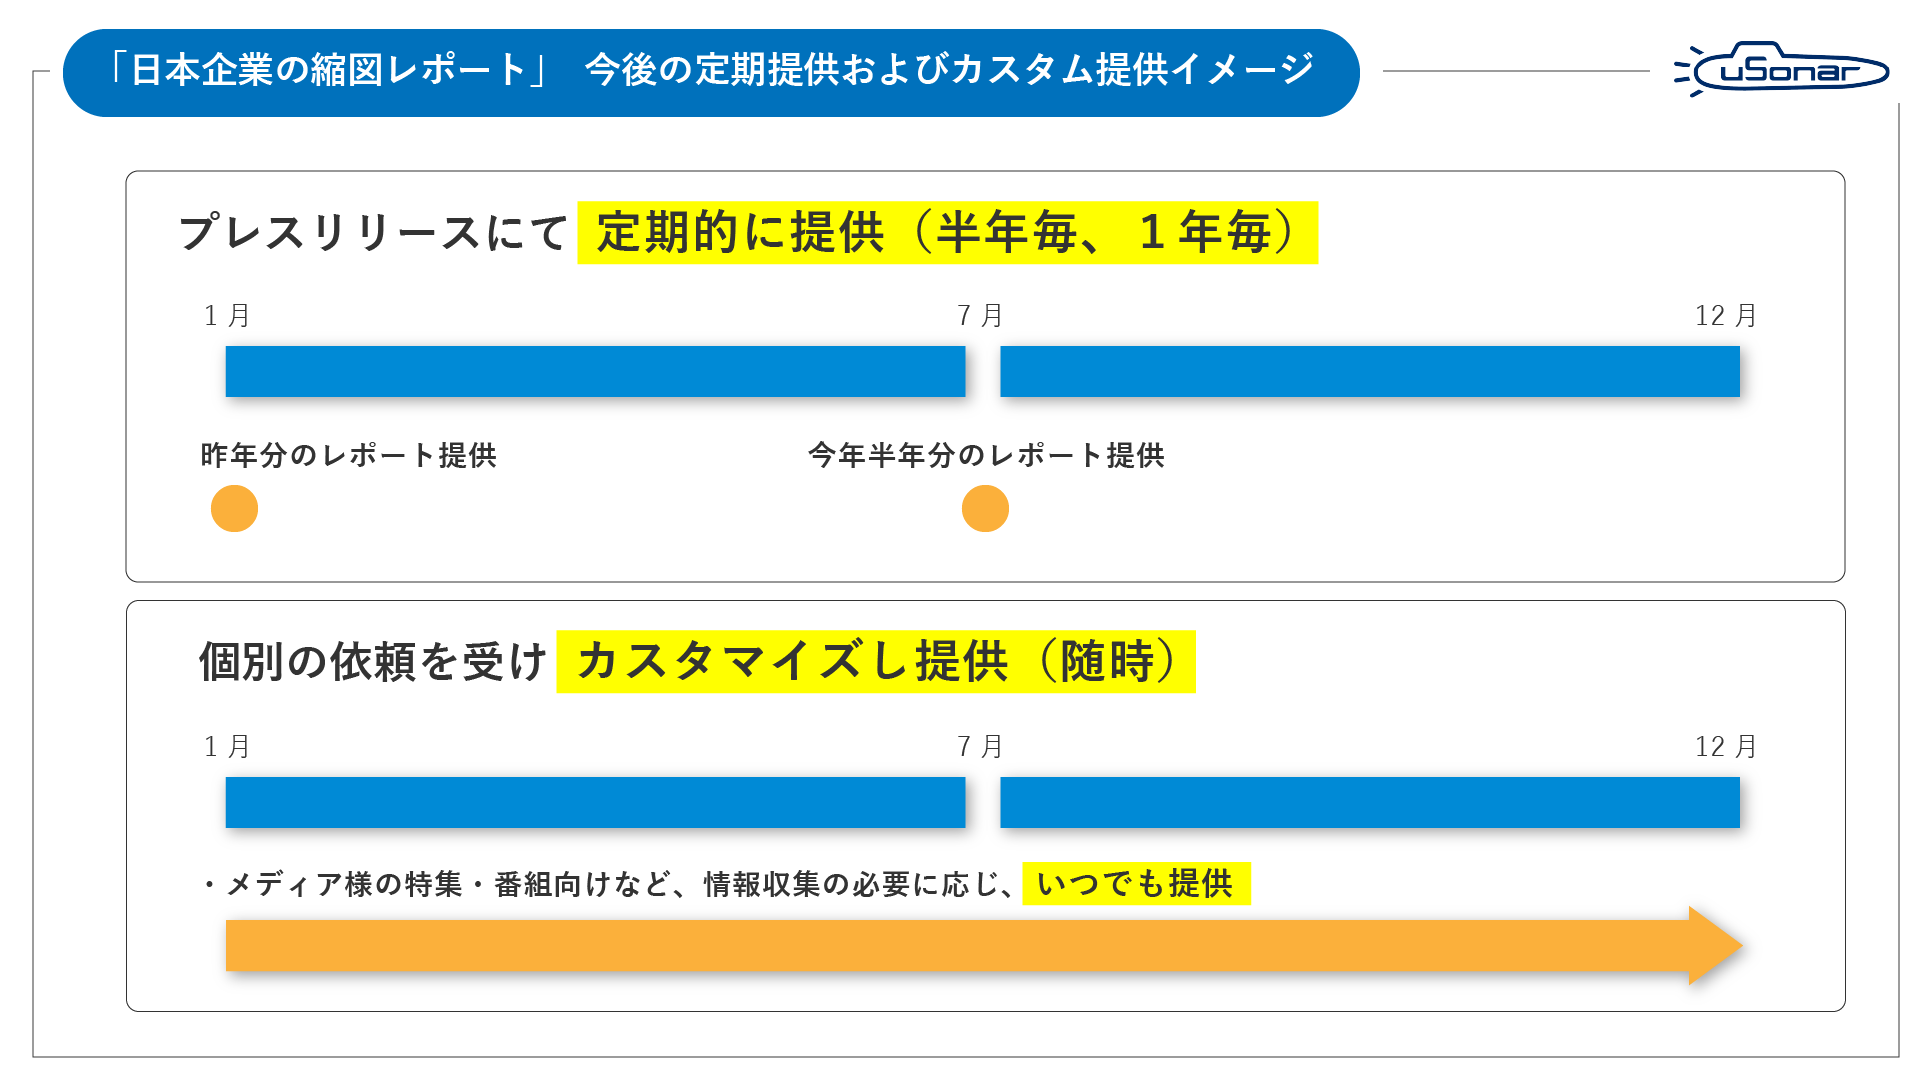
• Frequency of Periodic Report Publication
Depending on the theme, press releases will be issued every six months or annually (scheduled for January and July).
- Provision of Individual Custom Reports (For Media)
In addition to our regularly published reports, we also create "Individual Custom Reports" based on requests from the media.
Reports that have been featured in the media may be distributed by our company to interested parties upon request.
Application Guidelines for Individual Custom Reports
Please contact us at the email address for "Japan Corporate Landscape Report" applications (ir@usonar.co.jp).
Once your inquiry is received, a representative from our company will contact you.
- Please note that we may be unable to fulfill certain requests depending on the content.
- This service is limited to provision (broadcast or publication) for news organizations, including television, newspapers, magazines, and web media.
- When publishing in the media, please credit the source as "Provided by uSonar Co., Ltd. 'Japan Corporate Landscape Report'."
Public Relations, uSonar Co., Ltd. (Hiyama/Sawada)
Email: ir@usonar.co.jp
Phone: 03-5388-5300